Building Phylogeny
First we import the Trisicell pakcage as:
[1]:
import trisicell as tsc

tsc.settings.verbosity = 3  # show errors(0), warnings(1), info(2), hints(3)
tsc.logg.print_version()
Running trisicell 0.0.13 (python 3.7.10) on 2021-09-03 10:26.
[2]:
adata = tsc.datasets.example()
[3]:
adata
[3]:
AnnData object with n_obs × n_vars = 83 × 452
    obs: 'group', 'subclone_color', 'Axl', 'Erbb3', 'Mitf', 'MPS'
    var: 'CHROM', 'POS', 'REF', 'ALT', 'START', 'END', 'Allele', 'Annotation', 'Gene_Name', 'Transcript_BioType', 'HGVS.c', 'HGVS.p'
    layers: 'genotype', 'mutant', 'total'
Here is the information about the cells:
[4]:
adata.obs
[4]:
| group | subclone_color | Axl | Erbb3 | Mitf | MPS | |
|---|---|---|---|---|---|---|
| cell | ||||||
| C15_1 | C15 | #B9D7ED | 6.328047 | 0.000000 | 0.000000 | -0.727720 |
| C15_2 | C15 | #B9D7ED | 6.978424 | 3.604071 | 4.066950 | 0.170112 |
| C15_3 | C15 | #B9D7ED | 7.418106 | 5.479295 | 5.460087 | -1.207896 |
| C15_4 | C15 | #B9D7ED | 8.461807 | 4.725196 | 2.711495 | -2.571793 |
| C15_5 | C15 | #B9D7ED | 6.884476 | 6.314334 | 0.000000 | -0.620660 |
| ... | ... | ... | ... | ... | ... | ... |
| C1_7 | C1 | #FF0000 | 7.931919 | 7.021924 | 3.656496 | 1.273881 |
| C11_4 | C11 | #FF00AA | 7.707152 | 6.642990 | 0.000000 | 0.644507 |
| C11_5 | C11 | #FF00AA | 7.078204 | 6.662490 | 0.000000 | 1.457377 |
| C11_8 | C11 | #FF00AA | 7.842476 | 4.391630 | 4.125155 | -0.198301 |
| C1_8 | C1 | #FF0000 | 8.679480 | 6.240505 | 0.000000 | -0.234657 |
83 rows × 6 columns
Here is the information about the mutations:
[5]:
adata.var
[5]:
| CHROM | POS | REF | ALT | START | END | Allele | Annotation | Gene_Name | Transcript_BioType | HGVS.c | HGVS.p | |
|---|---|---|---|---|---|---|---|---|---|---|---|---|
| mutation | ||||||||||||
| mutation_1 | chr1 | 15815968 | A | ['G'] | 15815968 | 15815968 | G | missense_variant | Terf1 | protein_coding | c.581A>G | p.Tyr194Cys |
| mutation_2 | chr1 | 37396158 | G | ['A'] | 37396158 | 37396158 | A | synonymous_variant | Inpp4a | protein_coding | c.2622G>A | p.Val874Val |
| mutation_3 | chr1 | 38045805 | T | ['C'] | 38045805 | 38045805 | C | missense_variant | Eif5b | protein_coding | c.2732T>C | p.Val911Ala |
| mutation_4 | chr1 | 51071476 | G | ['A'] | 51071476 | 51071476 | A | missense_variant | Tmeff2 | protein_coding | c.448G>A | p.Gly150Ser |
| mutation_5 | chr1 | 54997173 | A | ['G'] | 54997173 | 54997173 | G | missense_variant | Sf3b1 | protein_coding | c.2740T>C | p.Phe914Leu |
| ... | ... | ... | ... | ... | ... | ... | ... | ... | ... | ... | ... | ... |
| mutation_448 | chrX | 105877558 | A | ['G'] | 105877558 | 105877558 | G | synonymous_variant | Atrx | protein_coding | c.675T>C | p.Gly225Gly |
| mutation_449 | chrX | 134605536 | A | ['G'] | 134605536 | 134605536 | G | missense_variant | Hnrnph2 | protein_coding | c.629A>G | p.Tyr210Cys |
| mutation_450 | chrX | 155214105 | A | ['T'] | 155214105 | 155214105 | T | missense_variant | Sat1 | protein_coding | c.232T>A | p.Tyr78Asn |
| mutation_451 | chrX | 155574460 | A | ['G'] | 155574460 | 155574460 | G | missense_variant | Ptchd1 | protein_coding | c.1748T>C | p.Val583Ala |
| mutation_452 | chrX | 162761681 | G | ['C'] | 162761681 | 162761681 | C | missense_variant | Rbbp7 | protein_coding | c.123G>C | p.Trp41Cys |
452 rows × 12 columns
Now we will do some filteration to remove artifacts.
[6]:
tsc.pp.filter_mut_vaf_greater_than_coverage_mutant_greater_than(
    adata, min_vaf=0.4, min_coverage_mutant=20, min_cells=2
)
tsc.pp.filter_mut_reference_must_present_in_at_least(adata, min_cells=1)
tsc.pp.filter_mut_mutant_must_present_in_at_least(adata, min_cells=2)
Matrix with n_obs × n_vars = 83 × 268
Matrix with n_obs × n_vars = 83 × 267
Matrix with n_obs × n_vars = 83 × 267
[7]:
tsc.pp.build_scmatrix(adata)
df_in = adata.to_df()
[8]:
# df_out = tsc.tl.booster(
#     df_in,
#     alpha=0.001,
#     beta=0.2,
#     solver="SCITE",
#     sample_on="muts",
#     sample_size=20,
#     n_samples=9000,
#     n_jobs=16,
# )
df_out = tsc.tl.scistree(df_in, alpha=0.001, beta=0.2)
running ScisTree with alpha=0.001, beta=0.2
input -- size: 83x267
input -- 0: 9968#, 45.0%
input -- 1: 4020#, 18.1%
input -- NA: 8173#, 36.9%
input -- CF: False
output -- size: 83x267
output -- 0: 11308#, 51.0%
output -- 1: 10853#, 49.0%
output -- NA: 0#, 0.0%
output -- CF: True
output -- time: 59.0s (0:00:59.043201)
flips -- #0->1: 1881
flips -- #1->0: 27
flips -- #NA->0: 3194
flips -- #NA->1: 4979
rates -- FN: 0.320
rates -- FP: 0.00332758
rates -- NA: 0.369
score -- NLL: 4112.965352416734
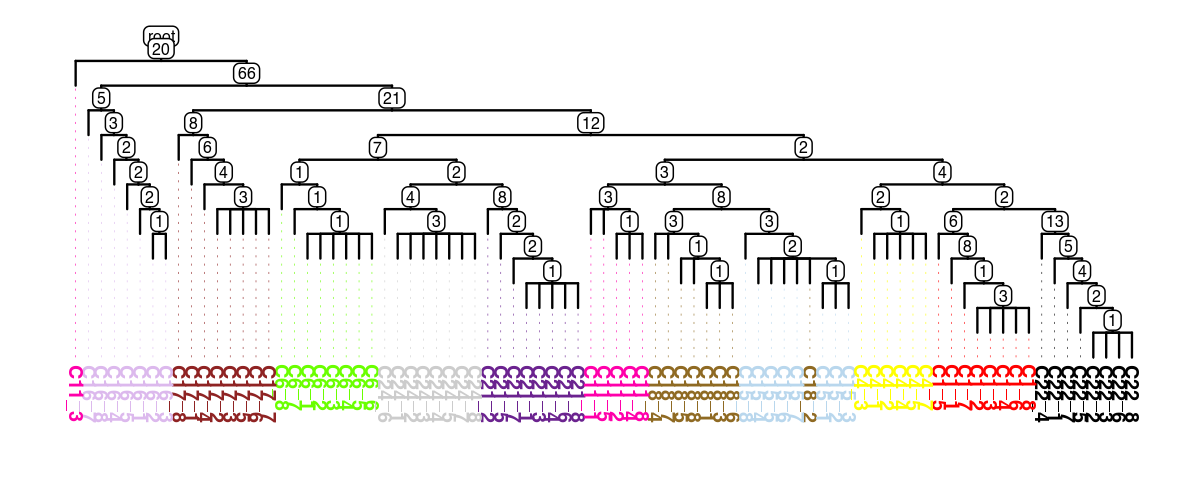
[9]:
tree = tsc.ul.to_tree(df_out)
tsc.pl.dendro_tree(
    tree,
    cell_info=adata.obs,
    label_color="subclone_color",
    width=1200,
    height=500,
    dpi=200,
)
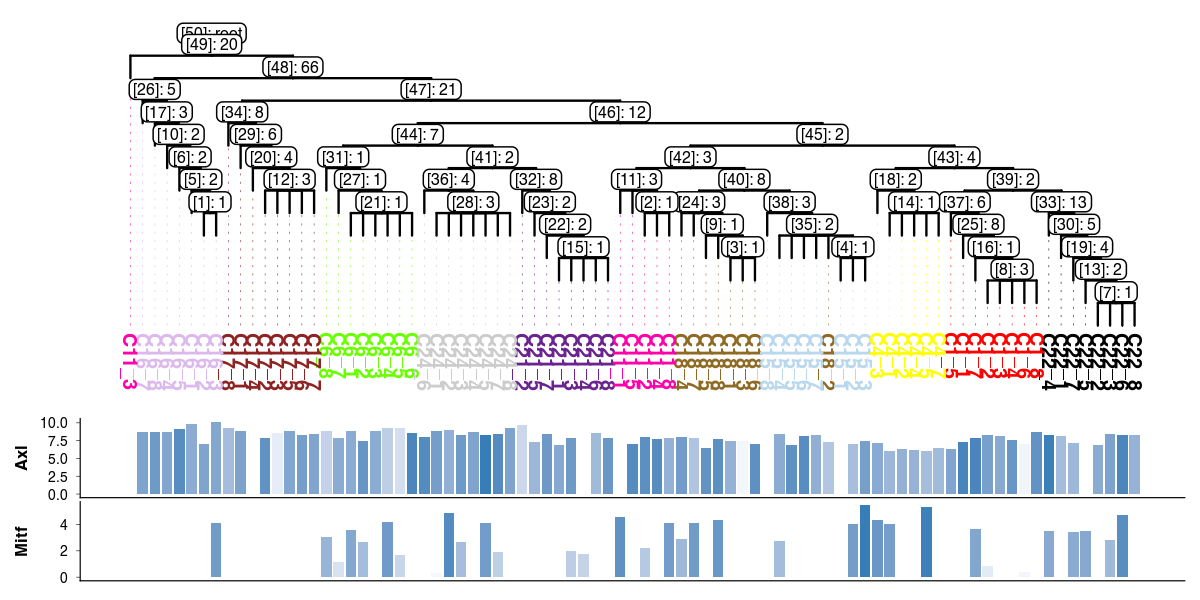
[10]:
tsc.pl.dendro_tree(
    tree,
    cell_info=adata.obs,
    label_color="subclone_color",
    width=1200,
    height=600,
    dpi=200,
    distance_labels_to_bottom=3,
    inner_node_type="both",
    inner_node_size=2,
    annotation=[
        ("bar", "Axl", "Erbb3", 0.2),
        ("bar", "Mitf", "Mitf", 0.2),
    ],
)
List of mutations branching at node with id [43]
[11]:
mut_ids = tree.graph['mutation_list'][tree.graph['mutation_list']['node_id'] == '[43]']
adata.var.loc[mut_ids.index]
[11]:
| CHROM | POS | REF | ALT | START | END | Allele | Annotation | Gene_Name | Transcript_BioType | HGVS.c | HGVS.p | |
|---|---|---|---|---|---|---|---|---|---|---|---|---|
| index | ||||||||||||
| mutation_162 | chr7 | 28042135 | A | ['C'] | 28042135 | 28042135 | C | missense_variant | Psmc4 | protein_coding | c.1109T>G | p.Ile370Ser |
| mutation_349 | chr13 | 103753116 | T | ['G'] | 103753116 | 103753116 | G | synonymous_variant | Srek1 | protein_coding | c.1039A>C | p.Arg347Arg |
| mutation_429 | chr19 | 4035556 | G | ['C'] | 4035556 | 4035556 | C | missense_variant | Gstp1 | protein_coding | c.550C>G | p.Leu184Val |
| mutation_8 | chr1 | 74287097 | T | ['G'] | 74287097 | 74287097 | G | missense_variant | Pnkd | protein_coding | c.242T>G | p.Ile81Ser |
[ ]: